The Circle of Economic Life
Narrow money in the US has been crushed - it cannot fall much further
Odd that the guardian of the world’s most important currency, the Fed, don’t seem to care a damn about actual dollars. They demonstrated this when they juiced money supply during the pandemic at a truly gargantuan pace. Less consequentially, but just as carelessly, the Fed ceased measuring broad money (M3) a few years ago. Then last year they trashed the definition of narrow money as well with the inclusion of other liquid deposits including savings deposits. They compounded that disrespect by failing to provide any continuous data series to show the before/after effect of their changes.
Maybe we shouldn’t have been surprised. Lack of care by its government and central bank for the currency is a defining feature of the dollar’s exorbitant privilege.
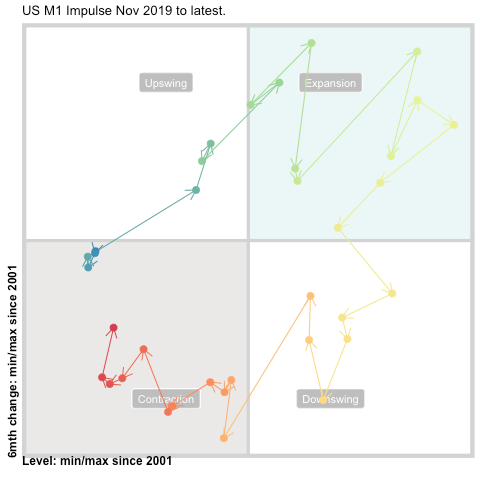
For visual impact and simplicity it sometimes helps to display important economic series in a quadrant, with the x-axis showing the ‘impulse’ (change over last year) and the y-axis showing rate of change of the x-axis (2nd derivative). In theory, as the financial/business cycle progresses, the series will rotate, clockwise around the quadrant, with the scale of the axes defined by long-term limits of the ‘impulse’ being measured. The result shows not only where a series is currently, but also where it is in relation to a relatively long history of its behaviour. It is often a helpful approach.
By fiddling about with bits of the weekly banking statistics that are published by the Fed, it is possible to recreate the original (and useful) M1 series. That recreated series is a real eye-opener in quadrant form.
I cannot recall such a perfect, or extreme, cycle expressed in just 3 years as US M1. The series moves through ALL the quadrants, and defines the limits of x-axes and y-axes for the last 20 years. Just ‘wow!’
And what does the current level mean? It means that M1 has contracted at a truly historic rate, with massive implications for both economic activity and financial markets.
But it also reveals that it is highly unlikely that such a rapid contraction can be sustained. Even the Fed cannot continue with such extreme monetary behaviour without really upsetting the American economic applecart. Already the decline in M1 implies declines in future inflation and economic activity.
The reduced supply of money, especially compared to other currencies, is a major reason for the dollar’s current extraordinary strength. Money supply in China, for instance, is currently expanding - implying further currency divergence between the world’s largest economic blocs.
Then, as we know, the Fed takes no notice of monetary aggregates. The massive turn around in M1 is unlikely to have any impact on policy. Not until inflation unambiguously turns over, or there is a financial accident close to home is there any chance of policy change. On that basis, it is likely the FOMC continue to tighten well into 2023. But the writing is increasingly on the wall, or at least on the chart above. The yield curve is likely to invert further as the Fed continues its cudgel approach to inflation and yields in the longer-date maturities may be near their peak. Given the FOMC’s current mission, the mighty dollar may not turn around yet.


Great visual. It is hard to come up with many positives when looking at the global macro environment as well. Seems like more rather than less pain ahead.