


When will the Fed f**k liquidity?
An option pricing approach

The Fed is engaged in a high-stakes ‘learning-by-doing’ exercise. The ‘ample reserves’ the FOMC aim to maintain is subject to an unknown lower bound. The Fed will only really know it has hit that lower bound when liquidity conditions tighten abruptly and unpleasant things start to happen in the financial plumbing. It will then pivot dramatically, as it did in September 2019 - the last time they hit the ‘lower bound’ of reserves. My own guess is the lower bound is between $2.2 and $1.8 trillion, and the uncertainties (volatility) around the parameters is high. How much should we be worry about the Fed hitting that lower bound and seriously disturbing system liquidity?
Actually, this looks like an option pricing problem, albeit one with uncertainty on more than one parameter. But let’s have a crack at defining the problem in option terms. Specifically, let’s use the Merton Model which is used to estimate corporate probability-of-default (PD). In our case, we want to estimate the probability of hitting the lower bound, but PD may be a useful reference in more than one sense.
There’s the current level of reserves [S], there’s a strike price [K] (the level below which reserves become a problem), there’s a QT plan to reduces securities on the Fed’s balance sheet. This allows us to project QT effects over 1 year [T] and we can assume more-or-less translates to a reduction in reserves relative to current levels [-r] and there is uncertainty about how reserves are drained [sigma].
Now, we don’t know what the lower bound is [K]. Still, using several different estimates of the lower bound makes the problem more tractable.
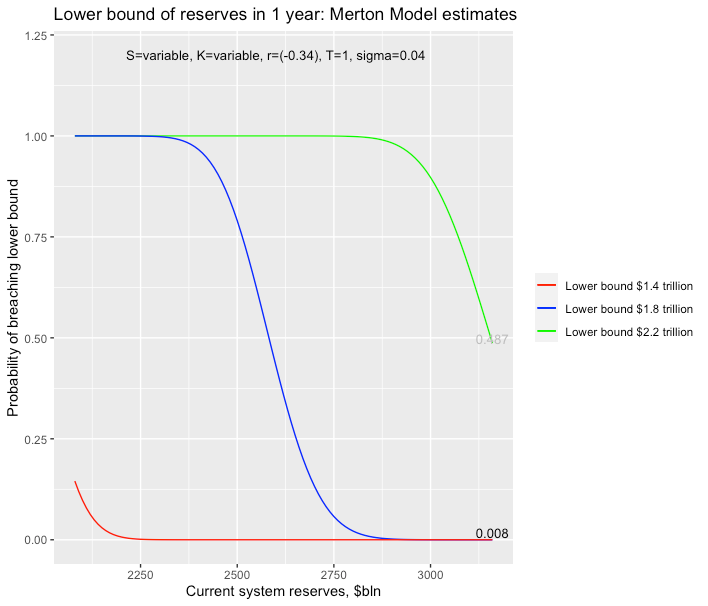
First let’s estimate the probability of hitting a lower bound of $2.2 trillion with the current plan to reduce holdings of Treasuries by a cap of $60bln per month and holdings of MBS by a cap of $35bln per month for the next 12 months. Yes, I know the actual fall in securities since full-speed was achieved in September was only $76bln per month (average), but for a start let’s assume that rises to the cap amount of $95bln per month over the next year, or $1140 per year.
S= 3160 ($bln), K= 2200 ($bln), T=1, r = -36% (3160/1140), sigma=4% (volatility of reserves annualised)
d2 = (log(S/K) + (r - sigma^2/2)*T) / (sigma*sqrt(T))
N(d2) = 49%
So, the probability of hitting a lower bound of $2.2 trillion is currently 49%, given our assumptions. In probability terms, this means the QT programme is right in the middle of the distribution and has a very high probability of hitting the $2.2 trillion lower bound. Obviously, that probability increases if the same run-off programme continues. So if we get down to reserves of $3000 billion then hitting a lower bound of $2.2 trillion is virtually assured in one year’s time.
We can now do the same calculation for a lower bound of $1.8 trillion and $1.4 trillion (the level at which problems emerged in September 2019, during the last bout of QT).
On the same assumptions the probabilities for these two guesses are effectively 0% probability of hitting those boundaries in one year.
What happens if the uncertainty about the behaviour of reserve holdings increases?
We can think of this as either an acceleration in reduction in reserves, or as a bigger uncertainty about the level of the lower bound - they are very similar things. Let’s chose an uncertainty of both terms that translates into a volatility of 15%. Well, then things look a bit different.
The probability of hitting $2.2 trillion boundary has increased a bit - not surprising because we already knew there was a high probability of hitting that boundary with lower volatility. What is interesting is that the probability of hitting the $1.8 trillion boundary is now 10%.
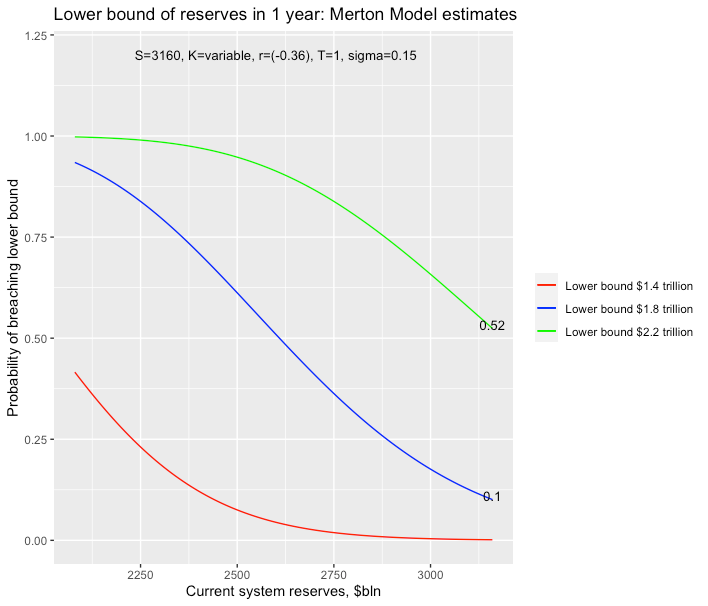
If my guess that the lower bound is between $2.2 and $1.8 trillion is right I’d be worried about these probabilities.