
"Let me tell you something. I’m from Chicago. I don’t break.” Barack Obama
The moving parts of Chicago futures deliveries help reveal dollar liquidity conditions

This post attempts to answer the mystery of why the ‘ dog didn’t bark’ at the end of Q4 2022, outlined in the post ‘A curious incident’ of 17th January.

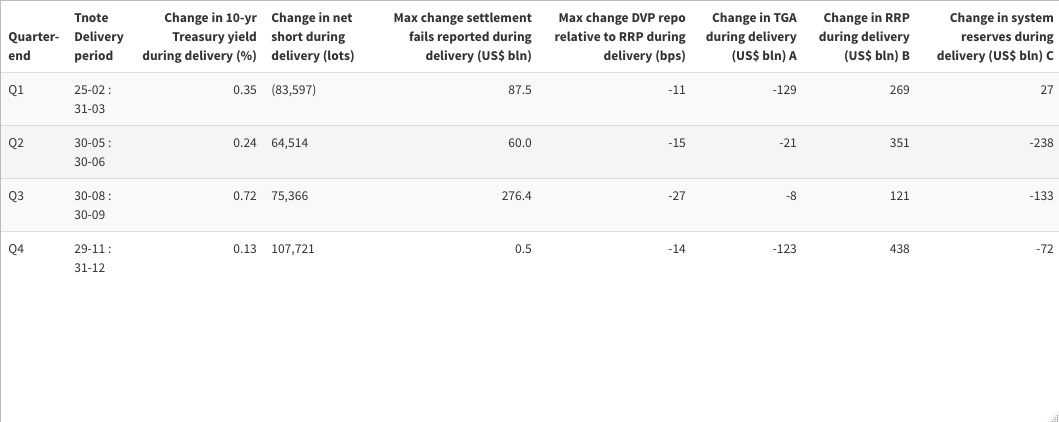
Bond futures short positions, traded on the Chicago Mercantile Exchange, create liquidity ‘pinch-points’ through the coincidence of window-dressing by dealer/banks and the delivery window leading up to quarter-end. We can learn quite a bit of the level of dollar liquidity and how it behaves from looking at the last four delivery windows.
During delivery periods the repo market reflects the tussle between those holding short positions, constraints on bank balance sheets and the background of ‘ample liquidity’. Judging from the results of the last year, this usually results in lower repo, an increase in settlement fails and more collateral placed at RRP by money-market funds. At least two of these factors were present at all quarter-end in 2022. All of three factors were observed at the end of Q1 and Q2 2022. Q3 quarter-end differed in that there was a limited rise in RRP, but an unusually large fall in repo rates and massive rise in settlement fails. The reduced usage of RRP seems to have forced shorts to accept much lower levels of repo with a knock-on effect in settlement fails.
Why was Q3 different? Two things stand.
1. There was almost no liquidity drain from the Treasury General Account at the end of Q3. That is the most significant take-away. In 2023, pay very close attention to the TGA.
2. The intense Treasury market selloff in Q3 increased the incentive to hold short positions, offsetting the added expense of the fall in repo rate.
Q4 quarter-end also showed some more typical features; lower repo rates and increase in usage of RRP. But in this case, there was hardly any increase settlement fails. Why the difference? One conjecture would be that the bearish sentiment in the bond market was lower than earlier in 2022, so the determination to hold shorts was reduced. That can be seen in both the lack of change in yield during the delivery period and the much higher reduction in net shorts in the futures market ( a fall of 107721 lots). RRP usage rose much more than in previous quarters, and acted as a support for repo and so reduced incentives to fail.
Dollar liquidity is dynamic, and, in general, it is falling due to QT. Futures help define the moving parts, and the most important moving part is now the Treasury General Account (TGA). As the Debt Ceiling debate continues, we expect the TGA to rise, possibly steeply, in case Congress fails to agree a new Debt Ceiling limit. A rise in the TGA is an absolute drain on liquidity and a big rise will impact liquidity demands elsewhere, placing upward pressure on repo levels, reduce usage of RRP by money-market funds and further encourage holders of short bond positions. The only large rise in TGA in the last year occurred in May 2022 during tax rebate season and was associated with a series of noticeable (though small) spikes in repo above the RRP rate.
My guess is if TGA usage doubles to US$ 800 bln there will be noticeable increase in repo, encouraging further short selling in bonds. I would also expect, absent encouragement from Debt Ceiling debate, that such a rise would be expected around April/May 2023. So, watch out for the TGA, but also pay close attention to delivery periods for signs of behaviour that deviates from the pattern of 2022.
This chart lines up the main factors, showing the beginning of the delivery window as a vertical dotted line, and quarter-end as a vertical solid line.

Hi Meyrick, Doesn't the TGA get liquidated during the Debt Ceiling anxieties to pay bills and will be re-built after the ceiling is passed when the Treasury can begin issuing debt again?
Also, I'm interested in the connection you draw between funding and deliveries in Chicago. I don't quite get the intuition behind the relationships. In an idealized sense, how should fails, RRP rates, TGA, etc, interact? You've included change in net short as a dimension but do you think actual deliveries would be a better dimension on which to analyze these relationships? If so, CUSIP level data can be found here:
https://www.cmegroup.com/clearing/operations-and-deliveries/registrar-reports.html