


'Dr Copper' and Mr Inflation don't agree
An unusual difference of opinion

It is always amusing when two well-known figures have a public spat. It seems Dr Copper is having a rare contretemps with Mr Inflation. Such open disagreement is rare enough to warrant comment.
HedgeAnalytics (my company) use our Framework approach to help us understand how shocks typically propagate across the financial system. Think of the global financial system as a error-correction system which is constantly in error and so constantly correcting. Not only is there a range of responsiveness to common shocks, there is also an order, though not necessarily an order that is rigidly adhered to. This also helps us identify ‘partial arbitrage’ opportunities. These occur where relationships are disturbed that typically react with a degree of stationarity (oscillate in a range).
One such relationship is Copper and the 5-year/5-year forward Breakeven Inflation Expecation Rate, often cited by the Fed as the benchmark market assessment of future inflation. But boy, has it recently show a major disturbance! It is also a relationship highlighted by the Framework as normally bounded.

The link in price behaviour between these two market series is visible by standardising the price behaviour of both (to place them on the same scale). This is the relationship going back to 2010.
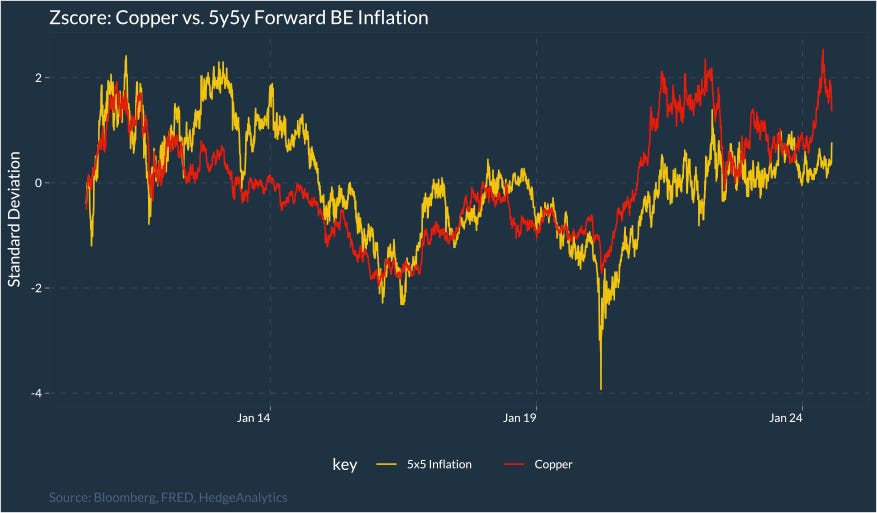
Yes, there are periods when the series deviate; their price responses to unfolding developments is not uniform. In terms of variance, however, they normally show high degree of correlation though not always simultaneously.
But in the last week, the two series have moved radically in opposing directions. While divergence is not uncommon, such large moves in opposing directions is highly unusual.

You can argue that copper had been signalling that industrial input prices would stay high, and inflation is finally reacting. But given past linkages in variance, that seems unlikely. You can also argue that one series may be pre-empting a forthcoming correction from the other. That seems plausible.
And if we pass the two series through our Framework to standardise price behariour for the drivers of each market we see the relationship has reached an extreme level not seen for the last 15 years.

If I was a betting man (and I leave it up to you to decide if that is the case), I would be tempted to bet this relationship will quickly turn back towards the zero line. That suggests either copper is currently too cheap, or 5y5y Inflation Breakeven levels are too high.
Meyrick, I wrote about a breakdown of relationships between commodity currencies and commodity prices over at Money Inside and Out. There may be a read through to your observation on Cu and 5/5. One thing that springs to mind for the overall time series (not just the recent curiosity) is that the copper price broke out of its historical nominal range due to the cost shock of the 2021-23 period, and that the new SRMC level creates a floor that prevents it from adjusting back to pre-pandemic nominal levels ($8000/t is the new $4000/t in LME terms). In other words, there is a structural break.
Having been involved in the markets for more than 40 years, I sense that the current situation of correlation breakdowns is unprecedented. while it was not unusual in the past for one or two long-term correlations to break, it is almost as though every relationship has busted. What exactly does risk-on or risk-off mean anymore? Ultimately, I cannot look at the copper market, and take my understanding on what is required to dig more of it out of the ground (which while not exhaustive is reasonably robust as I continue to try to learn more about the processes) and see that over time, the red metal must rally. but these days, timing is incredibly difficult. it could take 6 months of further decline before something catalyses a rebound.