A group of nuns in a building is called a ‘convent’. If the same group of nuns gather in the street their collective description becomes a ‘habit’. Is the collective word for ‘unprecedented’ also a ‘habit’? We seem to developed a ‘habit’ of ‘unprecedented’ return expectations which may need correction. When the stereotypical ‘risk-free’ rate of the world’s reserve currency becomes one of the highest rates available across all (or many) asset classes, the tenets of Modern Portfolio Theory might indicate some wacky profound theoretical implications. Or is it an illusion, created by layering different time frames? Of course, it’s the latter, though that too has some interesting implications, because it probably reflects bad habits.

A neat chart from the Financial Times that has escaped onto social media shows the recent convergence of yields of corporate bonds, 3-month Treasury Bills and expected forward earnings yield of the S&P500.
The Financial Times chart is deliberately chosen for dramatic effect - the lines seem destined to culminate in convergence. As a propaganda eye-catching effort it’s undeniably effective.
In fact, FRED data shows AAA corporate yields are significantly lower than 3-month Treasury Bill rates, with data going back considerably further than that used by the FT.
But - and you knew there would be a ‘but’ - the comparison of a 3-month Treasury Bill with a AAA corporate bond with a maturity of 3-5 years is conceptually flawed. The spread may tell you nothing about relative returns because the time scales are not aligned. You cannot hold the 3-month Treasury Bill for the duration of a typical corporate bond and be confident of a steady return from the Bill. A better comparison would be AAA yields to 10-year Treasury yields - which wouldn’t yield (!) the same dramatic chart at all.
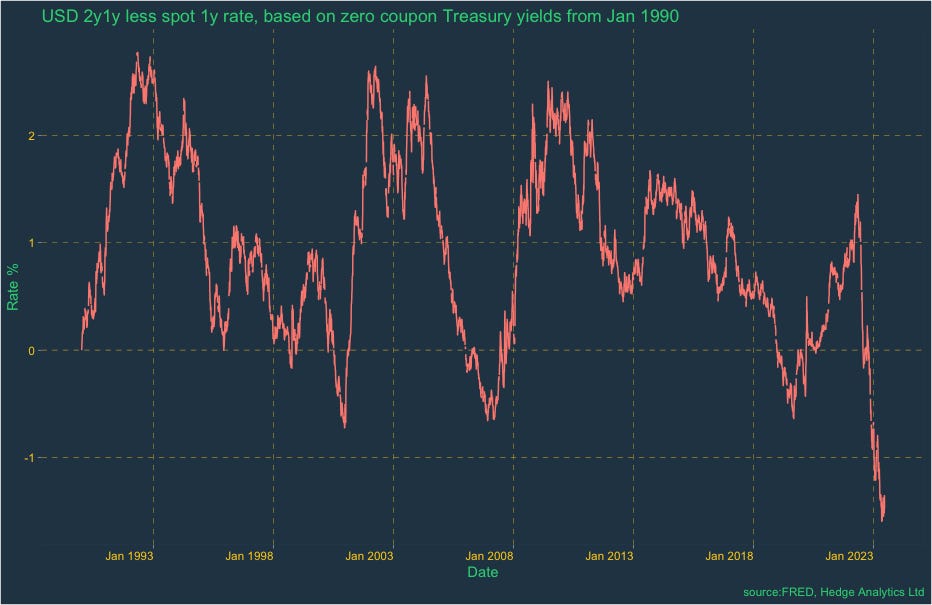
To illustrate the point look at the following chart of forward Treasury rates against the spot 1-year rate. You don’t have to squint too hard to realise the forward spread chart is pretty much the same as the Bills/AAA chart above, though with different y-axis. Which tells you that the rates convergence illustrated in the Financial Times chart reflects different time horizons, possibly the different time horizons reflected in the forward rate curve. The FT chart and my AAA/Bill chart have not a lot to do with expected asset class performance. They both have a lot to do with current versus expected funding costs.
Moreover, there’s a selection bias in both my and the Financial Times charts. If I’d taken the T-bill/AAA spread chart back as far as possible the apparently ‘unprecedented’ move into negative spread becomes precedented on several occasions. Admittedly it is hardly a ‘habit’, but it does show that deeply negative spreads between short rates and bond yields are not unknown. And if we compare the longer chart to the history of Fed Funds over the same time horizon, it becomes clear that the reason for the negative spread is the level of Fed Funds. The higher the Fed Funds level, the more likely the spread is to become negative - with multiple episodes of negativity in the late 1970s and early 1980s under Fed chairman Volcker.
But here’s the thing: the rates needed by Paul Volcker and his Fedsters to push spreads negative were two or three times higher (12-18%) than current Fed Funds rate.
The convergence of spreads (and the steeply inverted forwards) is really telling us, and the Fed, that the current (historically moderate) levels of Fed Funds rate are incompatible with forward expectations over any period greater than about 1 year. If the current batch of Fedsters could credibly promise that rates will remain at current levels it seems highly unlikely that the inversion would be so pronounced or that the negative Bill/AAA spread could continue. The expected equity yield is likely to be much higher, meaning equity prices would be lower, possibly much lower.
Black Scholes requires the ‘risk-free’ rate as an input to calculate the forward price against which to compare expected volatility, resulting in a price of an option. Turning that logic around, the current configuration of market yields suggests the forward level of Fed Funds (and Treasury Bills) needs to be significantly lower to maintain the expected returns of multiple asset classes. The bad habit of returns expectations is so engrained it may take a shock, like higher Fed Funds for longer to reform investors behaviour.


